When the user clicks on a particular object from the object list, a playback option appears on the top center of the live tracking screen, which displays the playback of the object for the time selected by the user.
Go to Object tab > Click on object > Hover to playback to select the playback time period as shown below:

By clicking on the required timeframe, the playback screen will load which will be as below:

There are four bars/tabs/windows in Playback, which are as below:
Settings Bar
Settings Bar lies in the top center of the screen. On this bar, users can find various settings options.
-png-1.png?width=522&height=94&name=new2%20(1)-png-1.png)

 The playback appears for the time period selected from the options.
 , the playback settings tab can be opened/closed.
Playback Settings Tab
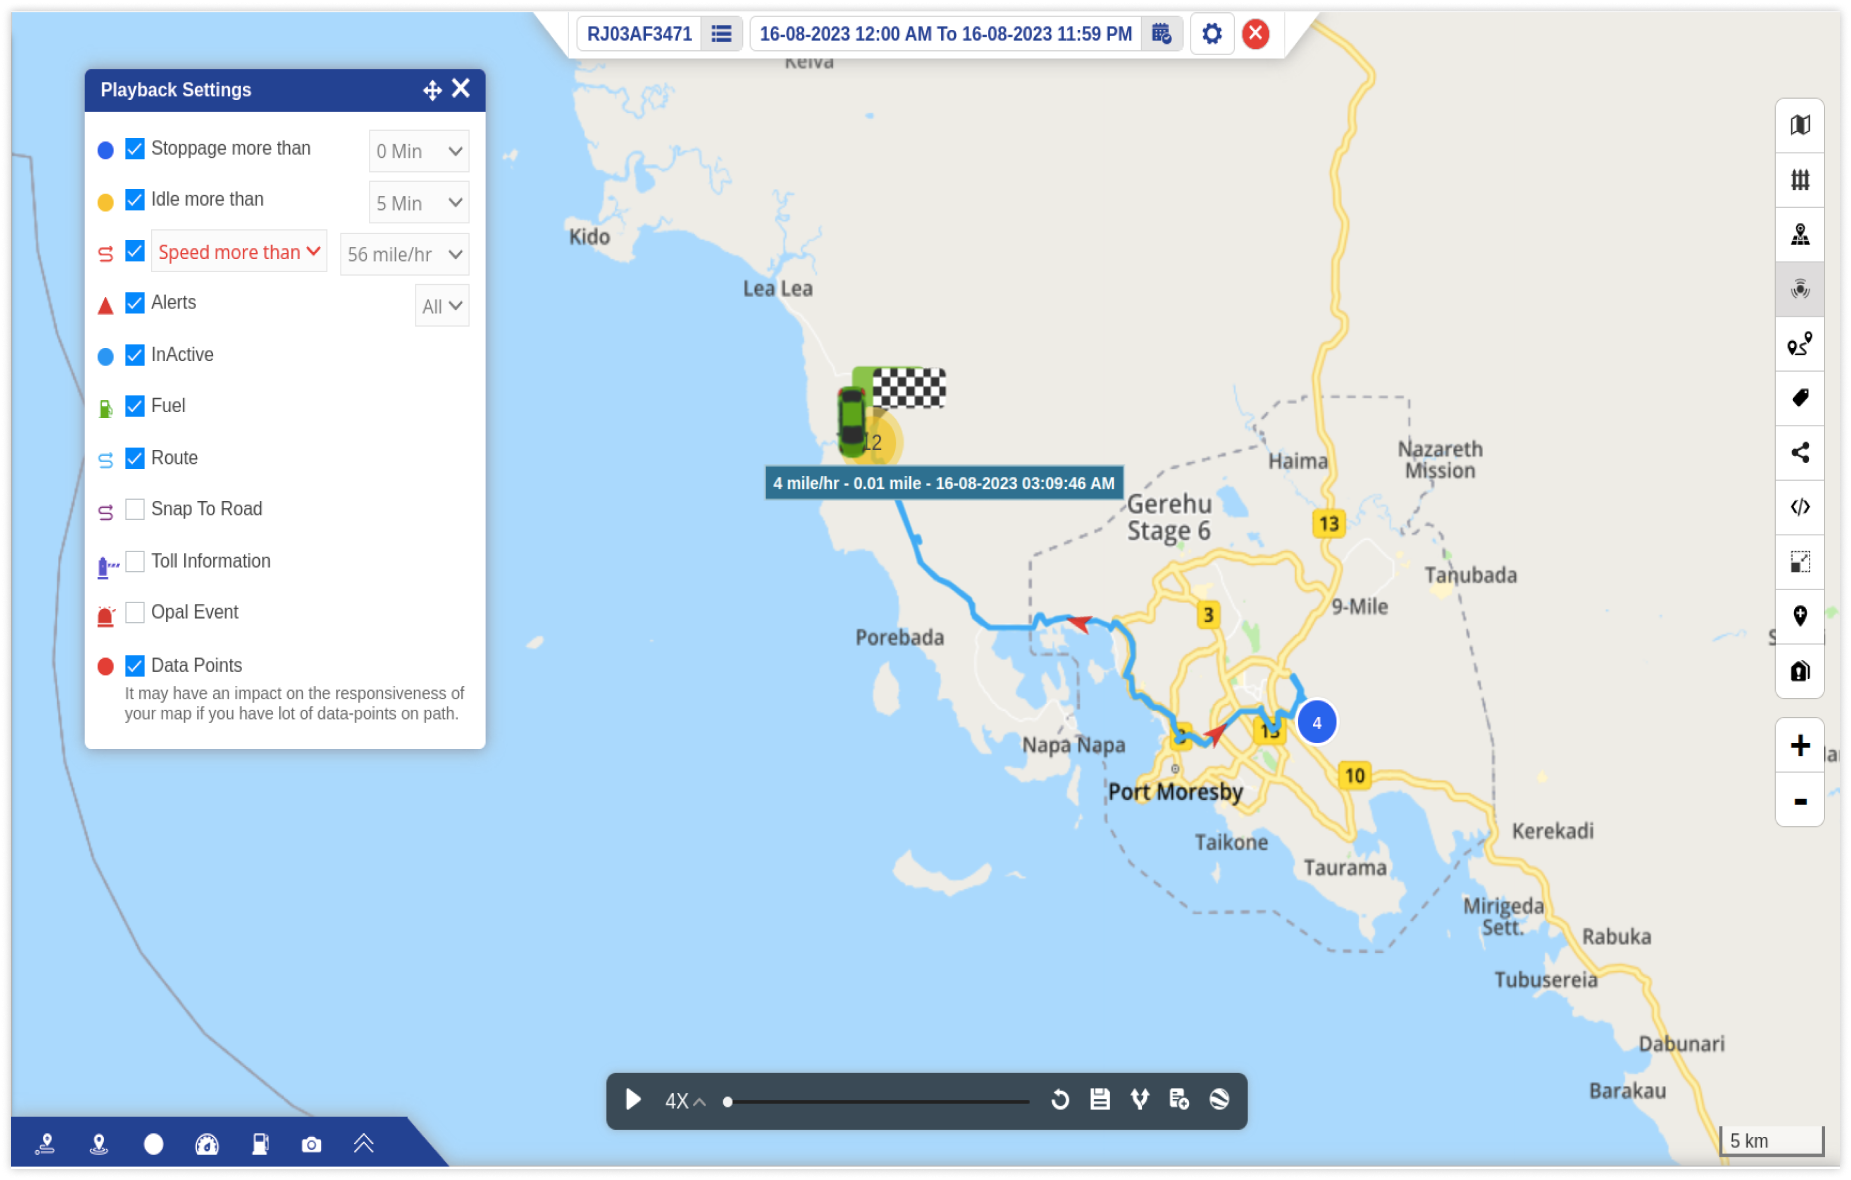
The Playback Settings Tab appears on the right side of the screen. From this tab, the user can select what data points to display on the playback path. Some of these data points are feature oriented.
As it can be seen in the image below, data points like alerts, inactive, fuel, route, etc. can be checked/unchecked as per requirement. All the data points that are checked will appear on the playback route.
%206-png.png?width=347&height=374&name=Untitled%20document%20(1)%206-png.png)
Similarly, all the other data points can be viewed on the playback as per the selection made by the users. Some of the data points are feature oriented.
Playback Bar
The Playback Bar is the bar which appears at the bottom center of the screen. Using the playback bar, various operations can be performed on the playback of the selected object.

 button, a window opens on the left side of the screen as below:
.png?width=286&height=354&name=cw%20(1).png)
-png.png?width=25&height=25&name=Frame%20(1)-png.png) to create a job of that particular playback.Learn more about job configuration.
to create a job of that particular playback.Learn more about job configuration. to download the KML file of that particular playback.
Playback Details Window
The Playback Details Window opens when you click on the upward arrows from the bar in the bottom left corner of the screen. The window can be minimised by clicking the downward arrows.

The window that opens has multiple options, some of which are feature oriented. The features that are enabled will appear here.
Below given tabs will appear as the user clicks on the corresponding icons:
Trips Tab
Trips tab displays all the trip details of that particular playback. Details like Start/End time and location, distance, speed, alerts, driver, trip status are displayed in this tab.

These trips can be classified, by clicking on the edit icon in each row.
All this trip data can be downloaded in XLS format by clicking on the XLS icon on the right end of the tab as highlighted in the above image.
Events Tab
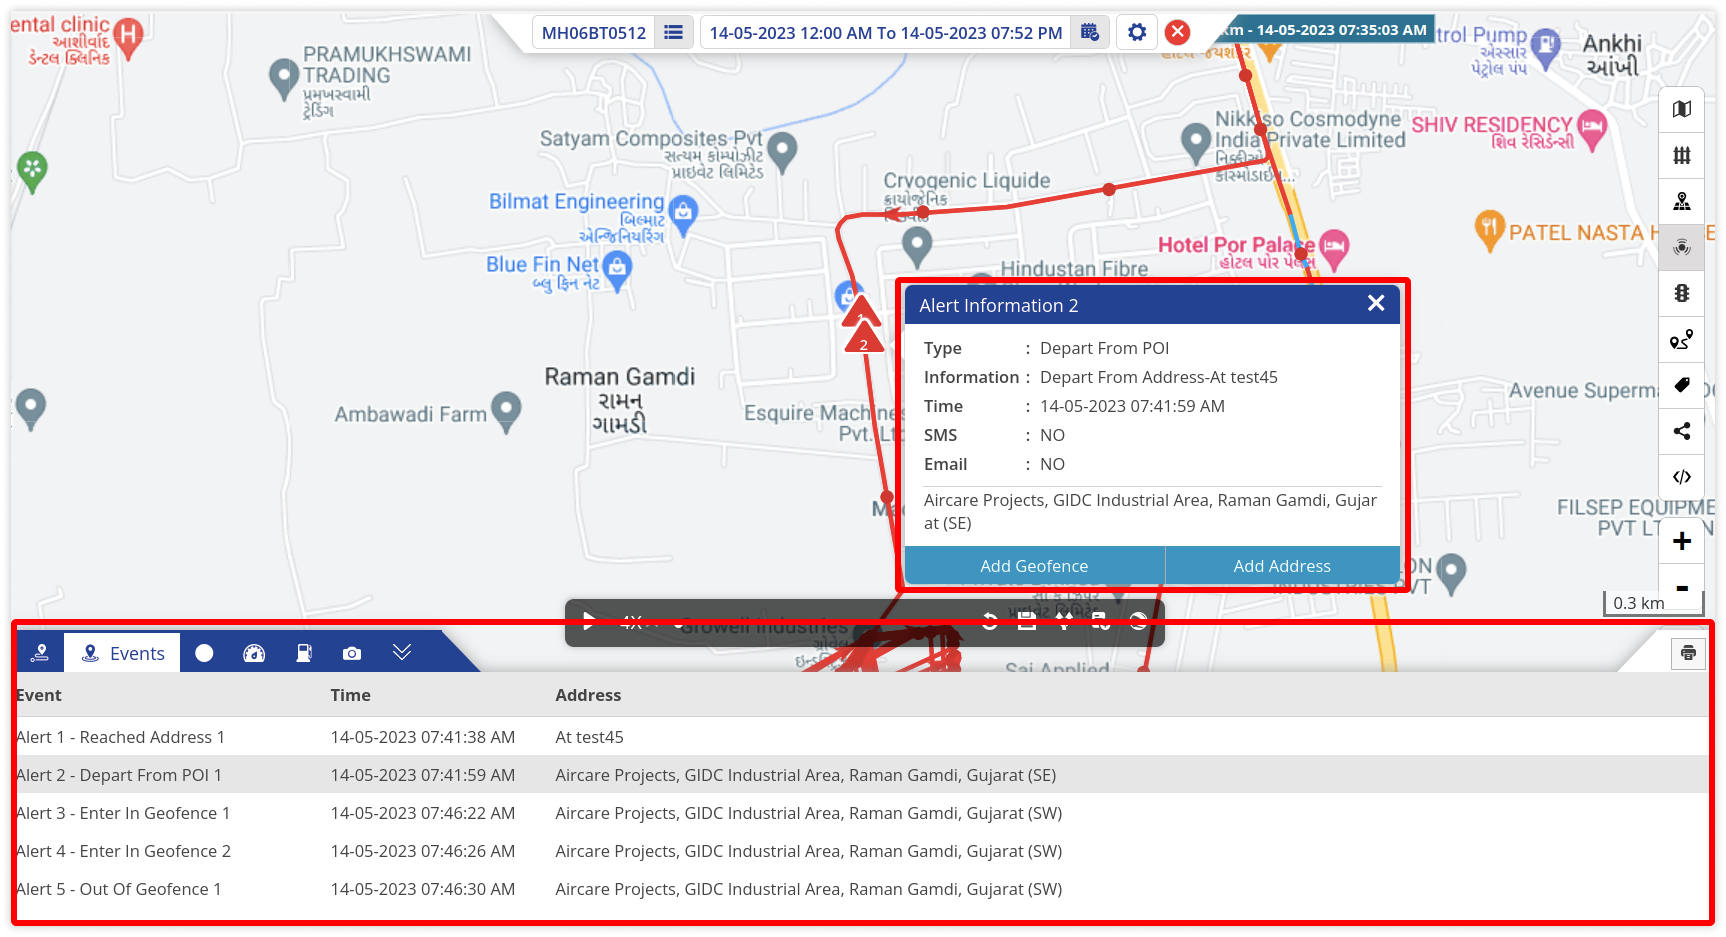
Events tab displays all the events that have occurred in that playback along with their time and address details. To print these event details, click on the print button on the right end of the tab as highlighted in the below image.

When a user clicks on a particular event, a new window with details of that particular event opens. Details like reached time, depart time, position and address are displayed as shown in the image below.
A user can also add address and geofence from this event details window.
Learn more about address configuration and geofence configuration.
Data Points Tab
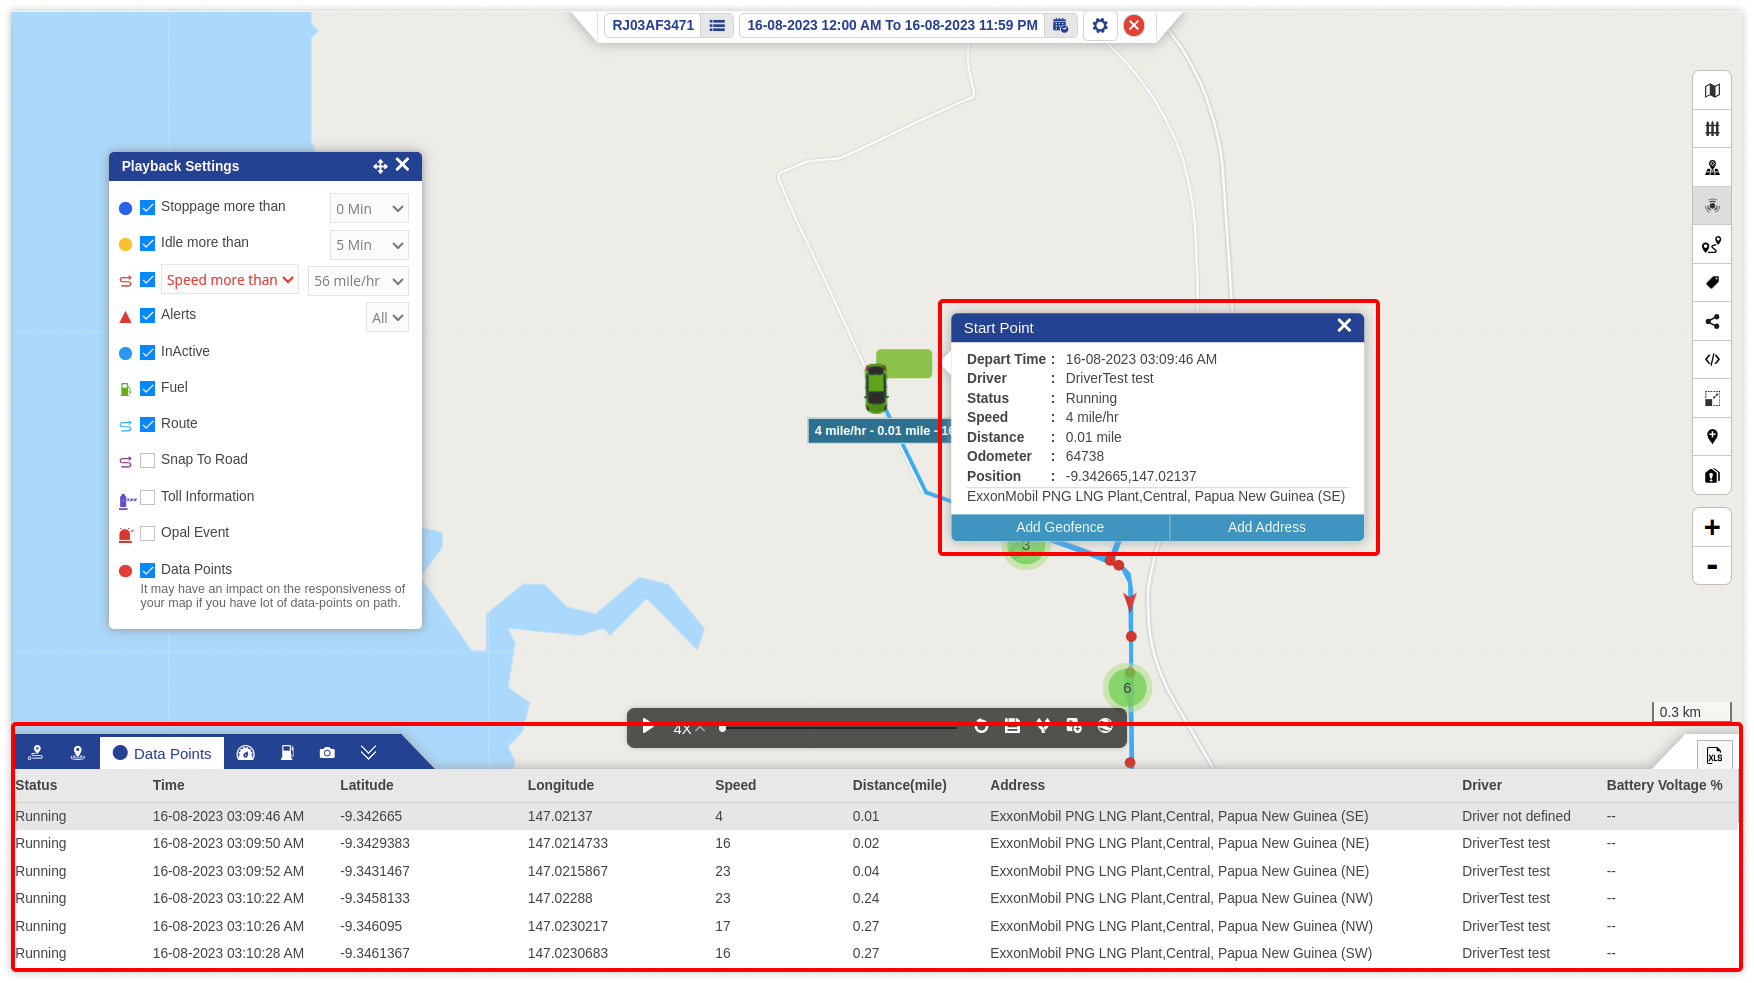
Data Points tab displays all the data points with details like status, time, latitude/longitude, speed, distance and address.
These details can be downloaded in XLS format by clicking XLS icon on the right end of the tab as shown below.

When a user clicks on a specific data point, a new window with detailed information of that point opens as shown in the above picture. A user can add address and geofence from here as well.
Learn address configuration and geofence configuration.
Speed Tab
Speed tab is a feature oriented tab which displays the detailed information of speed of the object in that particular playback.
Learn more about the speed tab.
Fuel Tab
Fuel tab is also a feature oriented tab that graphically displays fuel details of the object in that playback.
Learn more about the fuel tab.
Image Gallery Tab
The Image Gallery tab is where all the snapshots from the MDVR are displayed for that particular playback. These images are captured at different data points and can be downloaded by clicking on the download button which is on the right end of the tab as shown in the image above.
This tab is displayed on the live tracking screen if the user has installed dashcams and is using the video telematics.